The Small Indomitable Tribe of North Sentinel Island
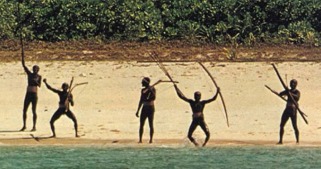
If it comes ashore, kill it, and bury it in the sand.
Region: India
Quicksearch Query: North Sentinel Island
|
Quicksearch: | |
NS Economy Mobile Home |
Regions Search |
North Sentinel Island NS Page |
|
| GDP Leaders | Export Leaders | Interesting Places BIG Populations | Most Worked | | Militaristic States | Police States | |
If it comes ashore, kill it, and bury it in the sand.
Region: India
Quicksearch Query: North Sentinel Island
| North Sentinel Island Domestic Statistics | |||
|---|---|---|---|
| Government Category: | Small Indomitable Tribe | ||
| Government Priority: | the Environment | ||
| Economic Rating: | Thriving | ||
| Civil Rights Rating: | Rare | ||
| Political Freedoms: | Unheard Of | ||
| Income Tax Rate: | 79% | ||
| Consumer Confidence Rate: | 96% | ||
| Worker Enthusiasm Rate: | 97% | ||
| Major Industry: | Basket Weaving | ||
| National Animal: | Missionary | ||
| North Sentinel Island Demographics | |||
| Total Population: | 11,269,000,000 | ||
| Criminals: | 1,110,676,924 | ||
| Elderly, Disabled, & Retirees: | 1,530,418,332 | ||
| Military & Reserves: ? | 597,754,520 | ||
| Students and Youth: | 1,803,040,000 | ||
| Unemployed but Able: | 1,581,404,039 | ||
| Working Class: | 4,645,706,184 | ||
| North Sentinel Island Government Budget Details | |||
| Government Budget: | $162,917,719,804,477.44 | ||
| Government Expenditures: | $138,480,061,833,805.81 | ||
| Goverment Waste: | $24,437,657,970,671.62 | ||
| Goverment Efficiency: | 85% | ||
| North Sentinel Island Government Spending Breakdown: | |||
| Administration: | $6,924,003,091,690.29 | 5% | |
| Social Welfare: | $0.00 | 0% | |
| Healthcare: | $0.00 | 0% | |
| Education: | $0.00 | 0% | |
| Religion & Spirituality: | $31,850,414,221,775.34 | 23% | |
| Defense: | $26,311,211,748,423.11 | 19% | |
| Law & Order: | $27,696,012,366,761.16 | 20% | |
| Commerce: | $8,308,803,710,028.35 | 6% | |
| Public Transport: | $0.00 | 0% | |
| The Environment: | $38,774,417,313,465.63 | 28% | |
| Social Equality: | $0.00 | 0% | |
| North Sentinel IslandWhite Market Economic Statistics ? | |||
| Gross Domestic Product: | $108,240,000,000,000.00 | ||
| GDP Per Capita: | $9,605.11 | ||
| Average Salary Per Employee: | $14,102.38 | ||
| Unemployment Rate: | 16.91% | ||
| Consumption: | $44,218,907,099,136.00 | ||
| Exports: | $26,820,256,202,752.00 | ||
| Imports: | $23,790,513,815,552.00 | ||
| Trade Net: | 3,029,742,387,200.00 | ||
| North Sentinel Island Non Market Statistics ? Evasion, Black Market, Barter & Crime | |||
| Black & Grey Markets Combined: | $562,972,138,057,785.25 | ||
| Avg Annual Criminal's Income / Savings: ? | $46,416.94 | ||
| Recovered Product + Fines & Fees: | $84,445,820,708,667.80 | ||
| Black Market & Non Monetary Trade: | |||
| Guns & Weapons: | $33,754,050,110,013.37 | ||
| Drugs and Pharmaceuticals: | $15,683,700,051,117.32 | ||
| Extortion & Blackmail: | $15,001,800,048,894.83 | ||
| Counterfeit Goods: | $48,414,900,157,796.95 | ||
| Trafficking & Intl Sales: | $34,776,900,113,347.11 | ||
| Theft & Disappearance: | $0.00 | ||
| Counterfeit Currency & Instruments : | $47,051,100,153,351.96 | ||
| Illegal Mining, Logging, and Hunting : | $38,186,400,124,459.57 | ||
| Basic Necessitites : | $0.00 | ||
| School Loan Fraud : | $19,093,200,062,229.79 | ||
| Tax Evasion + Barter Trade : | $242,078,019,364,847.66 | ||
| North Sentinel Island Total Market Statistics ? | |||
| National Currency: | Spear | ||
| Exchange Rates: | 1 Spear = $0.69 | ||
| $1 = 1.45 Spears | |||
| Regional Exchange Rates | |||
| Gross Domestic Product: | $108,240,000,000,000.00 - 16% | ||
| Black & Grey Markets Combined: | $562,972,138,057,785.25 - 84% | ||
| Real Total Economy: | $671,212,138,057,785.25 | ||
| India Economic Statistics & Links | |||
| Gross Regional Product: | $15,735,759,445,164,032 | ||
| Region Wide Imports: | $2,004,296,283,455,488 | ||
| Largest Regional GDP: | Nirupama | ||
| Largest Regional Importer: | Nirupama | ||
| Regional Search Functions: | All India Nations. | ||
| Regional Nations by GDP | Regional Trading Leaders | |||
| Regional Exchange Rates | WA Members | |||
| Returns to standard Version: | FAQ | About | About | 483,430,629 uses since September 1, 2011. | |
Version 3.69 HTML4. V 0.7 is HTML1. |
Like our Calculator? Tell your friends for us... |